Projects
Selected work in analytics, BI, and AI-driven systems.
UFC Event Analysis
Analyzing UFC pay-per-view events to determine the most profitable locations and timing, recommending increased fights in high-value markets like the UAE and targeting peak seasonal months in the US and Canada to maximize revenue.

Tools & Technologies: Python, Plotly, HTML/CSS
My Role: Data analysis and visualization
Key Results: Identified optimal markets and seasonal timing to maximize PPV and live gate.
Maghreb Esports Championship Analytics Platform
Comprehensive SQL-based analytics solution for a regional esports championship, analyzing tournament performance, team dynamics, and player statistics across multiple games. Built advanced queries to track team rankings, identify player transfers, analyze match patterns, and provide strategic insights for tournament organizers and team managers.

Tools & Technologies: SQL Server, T-SQL, Database Design, Performance Analytics
My Role: Database analysis, SQL development, performance metrics design
Key Results: Developed 30+ analytical queries covering team rankings, player transfer patterns, match analysis, and tournament insights. Identified key performance indicators and competitive dynamics across the Maghreb esports ecosystem.
Data Professional Survey Analysis Dashboard
Interactive BI dashboard in Power BI transforming raw global survey responses into actionable insights on roles, compensation, skills, and satisfaction.
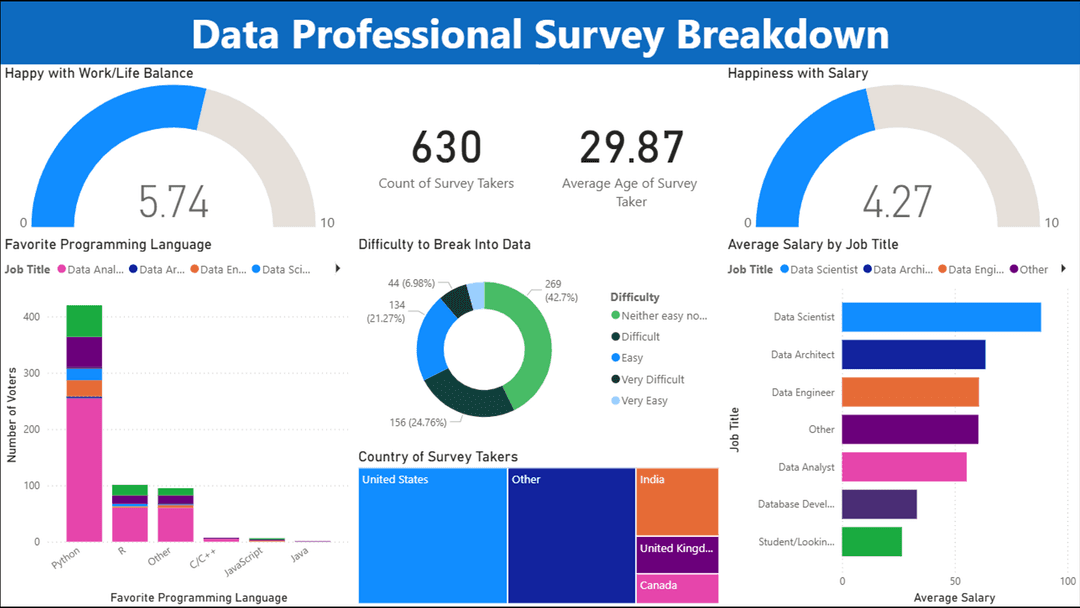
Tools & Technologies: Microsoft Power BI, Power Query (M), DAX
My Role: Data modeling, ETL with Power Query, DAX measures, dashboard design
Key Results: Revealed salary leadership for Data Scientists, highlighted work/life balance vs salary satisfaction gap, and quantified Python as top language preference across 630 respondents.
Netflix Content Analysis Dashboard
Comprehensive analysis of Netflix's content library exploring content distribution, genre trends, geographic origins, and audience demographics. Built interactive visualizations to understand content strategy, market positioning, and viewer preferences across different regions and time periods.
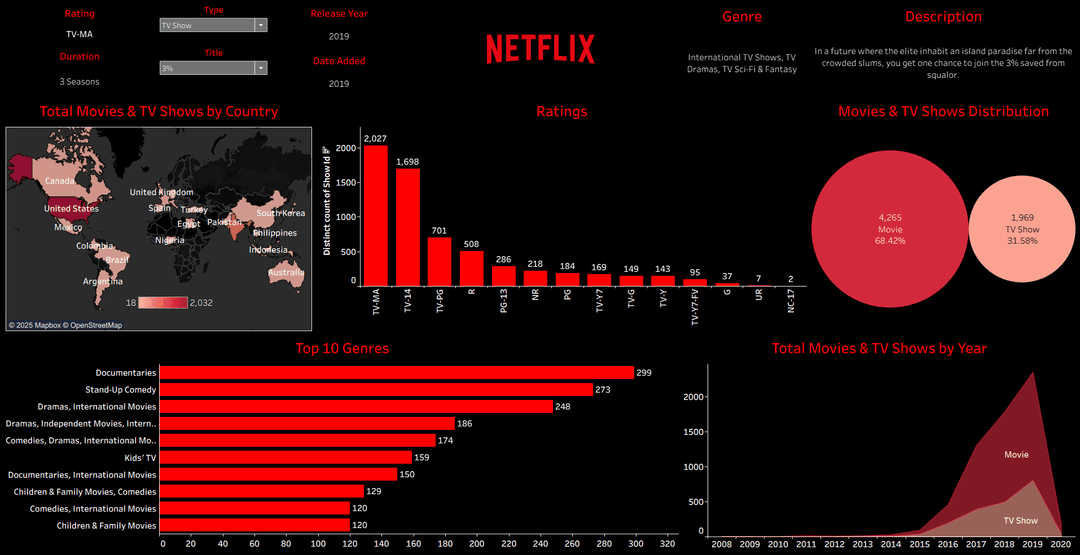
Tools & Technologies: Tableau Public, SQL, Google Sheets
My Role: Data analysis, visualization, and dashboard design
Key Results: Uncovered key insights about content distribution, identified top-performing genres and countries, and provided strategic recommendations for content acquisition and regional expansion.
Global E-Commerce Sales Performance Dashboard
Comprehensive data analysis and visualization project for a multinational B2C e-commerce company. Built an interactive Tableau dashboard to transform raw sales transaction data into actionable business intelligence, enabling stakeholders to track KPIs, understand customer behavior, and identify growth opportunities.

Tools & Technologies: Tableau Public, Tableau Desktop, SQL
My Role: Data analysis, visualization, and dashboard design
Key Results: Centralized sales data into a single source of truth, identified that returning customers generate 60% of revenue despite being only 25% of the customer base, and provided strategic insights for business growth.
JobyHunter — AI-driven Talent Acquisition System
Comprehensive talent acquisition platform with AI integration and advanced analytics dashboard. Built an end-to-end recruitment solution featuring web scraping, candidate screening, and HR analytics to optimize hiring processes and provide actionable insights for recruitment strategy.

Tools & Technologies: Python, ASP.NET Core, Angular, MongoDB, SQL Server, Power BI, Selenium
My Role: Led development, integrated web scraping, optimized architecture
Key Results: Reduced response times by 20%, improved hiring efficiency by 30%, and provided data-driven insights for recruitment optimization.
Sales Insights Engine
Comprehensive sales performance dashboard built with SQL Server Data Warehouse and Power BI using DAX measures. Analyzes sales performance across time, product lines, and order status to identify trends, top-performing products, and potential issues in the sales pipeline.

Tools & Technologies: SQL Server, Power BI, DAX
Data Source: Synthetic dataset
My Role: Data warehouse design, DAX development, and dashboard creation
Key Results: Identified critical sales pipeline issues with 55% of sales value in problematic statuses, provided actionable insights for inventory planning and marketing campaigns.
Employee Performance & Analytics
End-to-end HR analytics solution analyzing performance, absenteeism, turnover, and training data to provide actionable insights for improving employee retention and optimizing training programs.

Tools & Technologies: Tableau Desktop, Google Sheets, Tableau Public
My Role: Data analysis, visualization, and dashboard design
Key Results: Identified key workforce trends and provided strategic recommendations for employee retention and training optimization.
E-Commerce Sales & Customer Performance Dashboard
Comprehensive analysis of multi-national e-commerce data exploring sales performance, customer behavior, and product trends. Built interactive Tableau dashboards to derive actionable insights for optimizing marketing strategies, inventory management, and overall profitability.

Tools & Technologies: Tableau Public, SQL, Google Sheets
My Role: Data analysis, visualization, and dashboard design
Key Results: Identified key revenue drivers, customer segments, and geographic performance patterns, providing data-driven recommendations for business optimization.
Vivo Mobile Data Analysis — Turning Raw Specs into Market Insights
Analyzed Vivo mobile phone specifications to uncover strategic product positioning and consumer preferences. Applied Excel data cleaning techniques and PivotTable analysis to transform raw specification data into actionable business intelligence. Identified key market trends and popular configurations that drive Vivo's strategic focus on the budget and mid-range mobile phone market.

Tools & Technologies: Microsoft Excel (PivotTables, PivotCharts, Text to Columns, Formulas)
My Role: Data analysis, data cleaning, and dashboard design
Key Results: 8GB RAM + 128GB ROM was the most demanded configuration. Mid-range processors (Mediatek Helio P35, Qualcomm Snapdragon 680) dominate Vivo's lineup, strategically paired with 5000mAh batteries for the value-driven market segment.
More on my GitHub: github.com/RBenOthmen